History and SLA Breaches
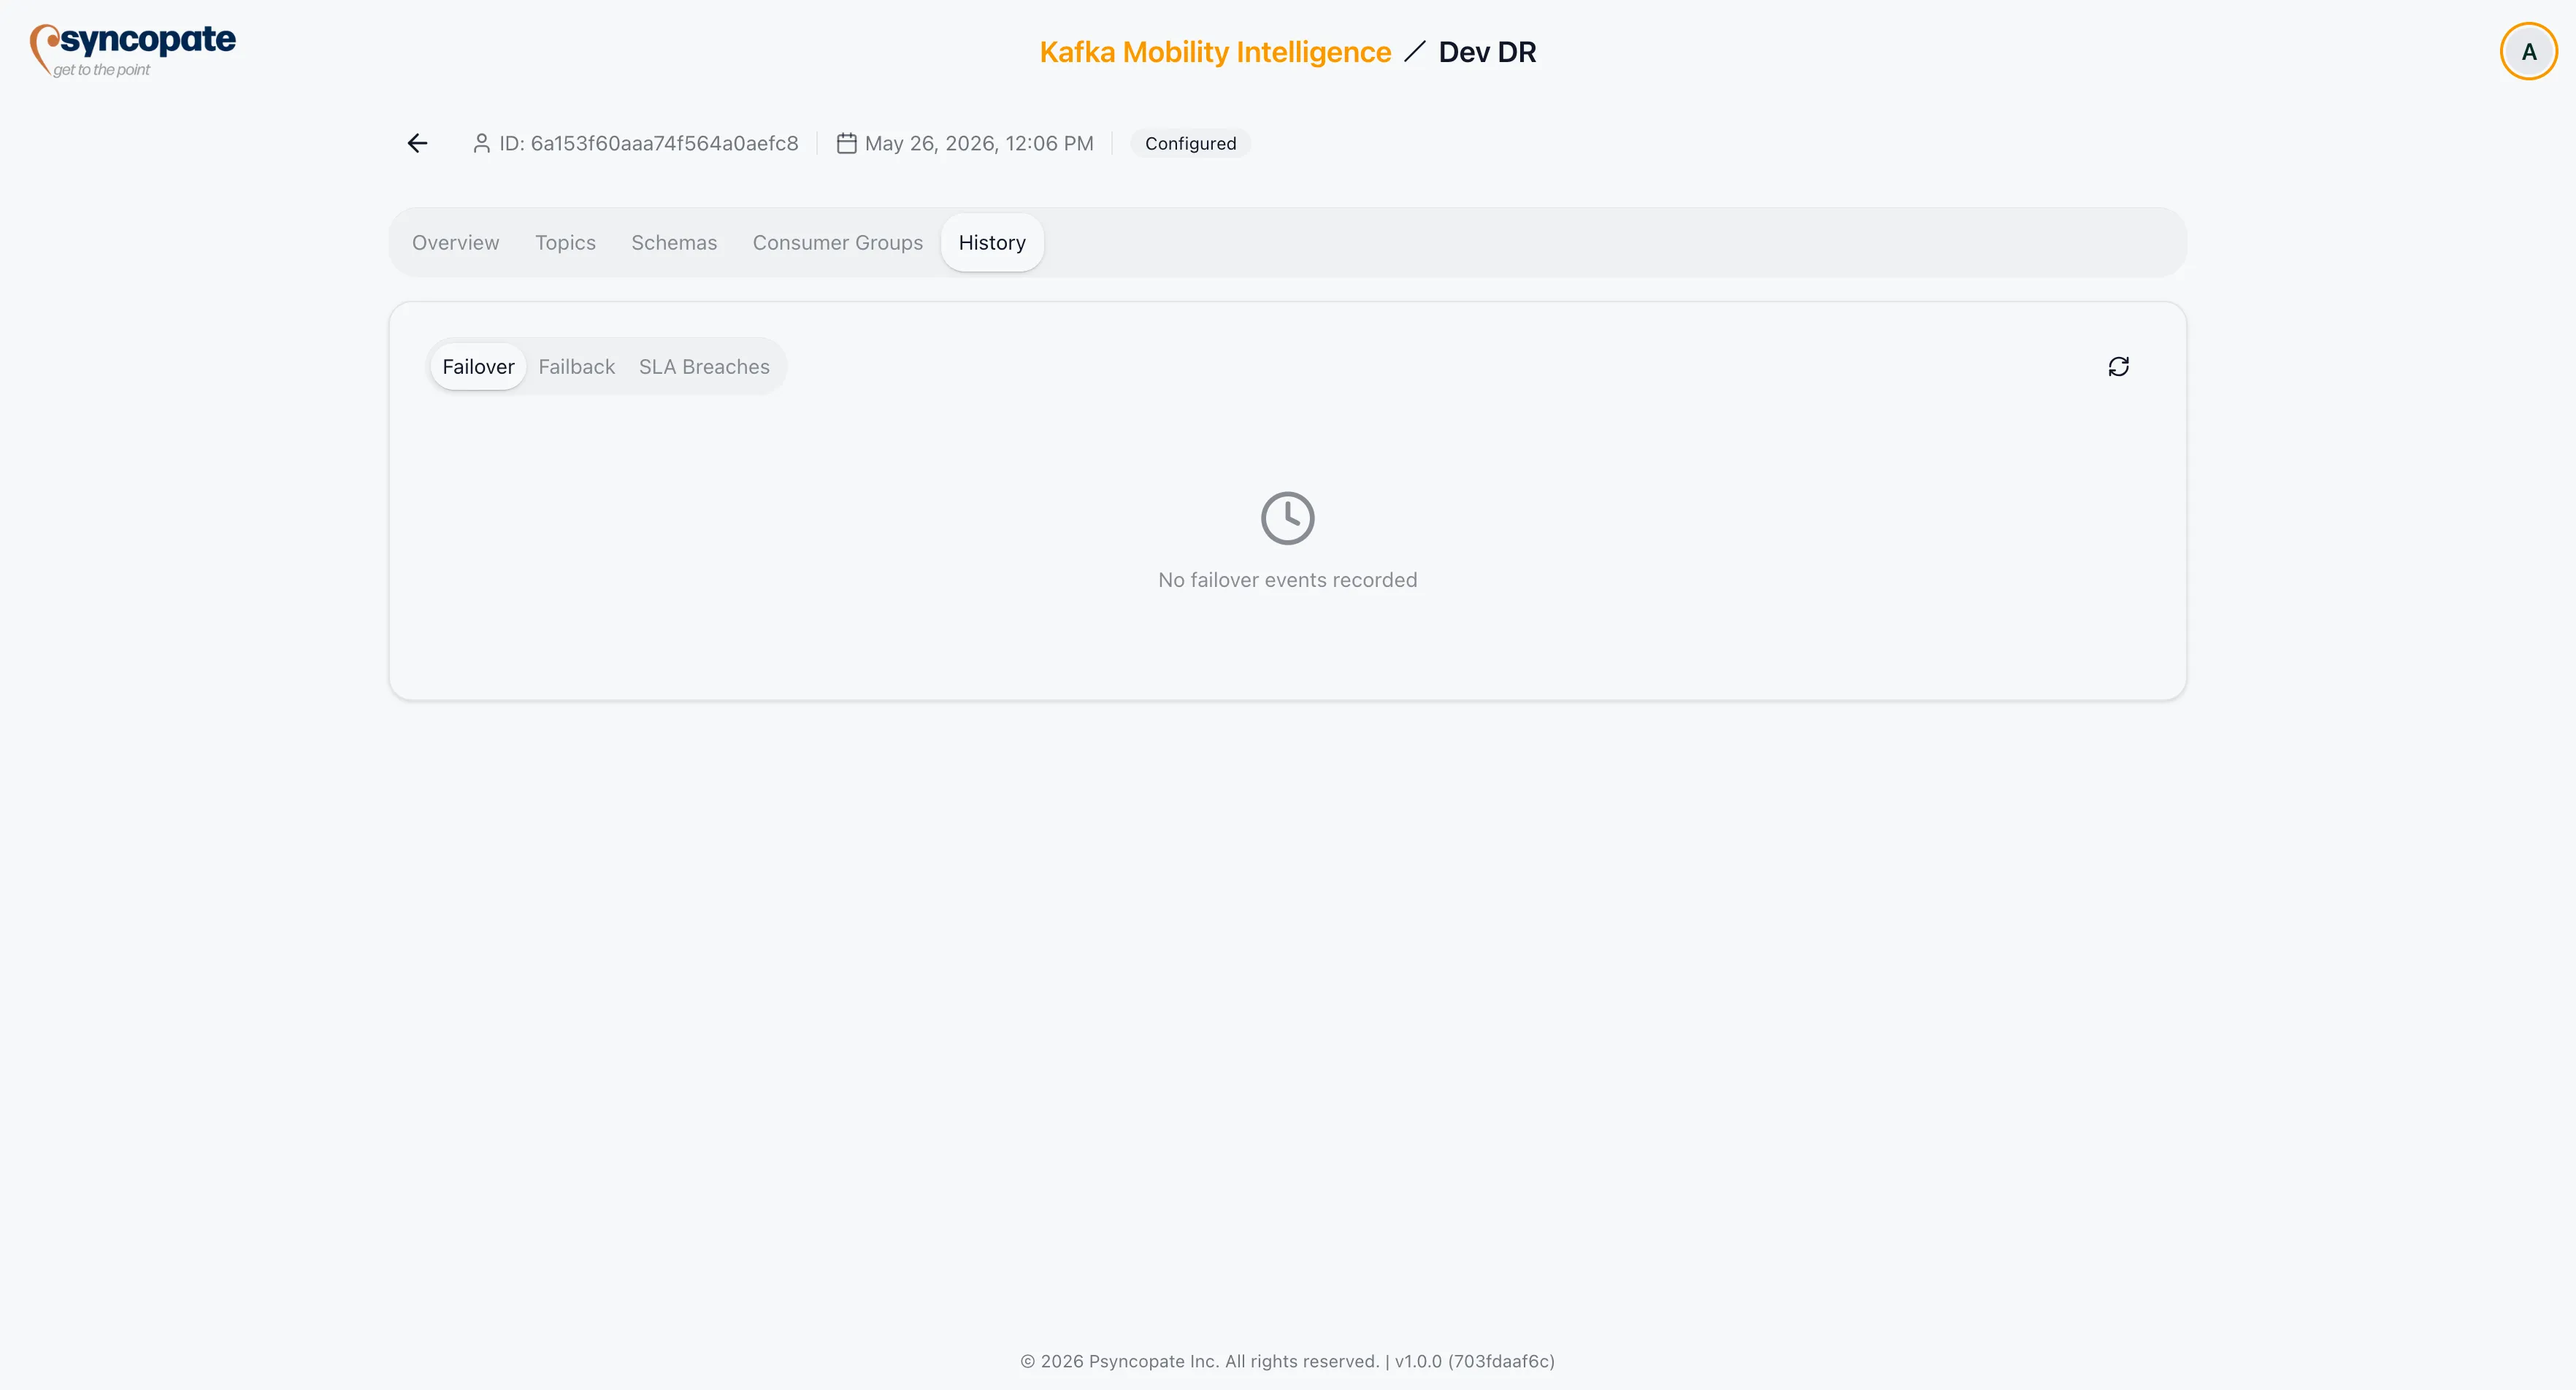
The History tab records all failover, failback, and SLA breach events for a DR setup.
Subtabs
Section titled “Subtabs”The History tab has three subtabs. Each shows a badge with the event count:
| Subtab | Content |
|---|---|
| Failover | All failover events (planned, emergency, test) |
| Failback | All failback events |
| SLA Breaches | All RPO and RTO breach events |
Failover and Failback Events
Section titled “Failover and Failback Events”Each event card shows:
| Field | Description |
|---|---|
| Timestamp | Date and time the event occurred |
| Type | Planned, Emergency, or Test |
| Scope | Full (all links) or Partial (selected links) |
| Result | Success, Failure, or Partial |
| Direction | From cluster -> To cluster (with cluster aliases if available) |
| Initiated By | Username of the operator who triggered the event |
| Actual RTO | Measured recovery time in milliseconds, if recorded |
| Auto-relink | Whether automatic re-linking was enabled for this event |
| Reason | Operator-provided reason, if entered at the time of initiation |
| Details | Expandable section with raw event detail text |
SLA Breach Events
Section titled “SLA Breach Events”Each SLA breach card shows:
| Field | Description |
|---|---|
| Timestamp | Date and time the breach was detected |
| Level | Warning, Critical, or Cleared (the breach has been resolved) |
| Dimension | RPO (time), RPO (messages), or RTO |
| Affected Resource | Link name and direction (RPO breaches), or cluster name (RTO breaches) |
| Current Value | Measured lag or duration at the time of the breach |
| Threshold | Configured threshold that was exceeded |
Pagination
Section titled “Pagination”Events are paginated. Use the Previous and Next buttons to navigate pages. The current page and total are shown between the buttons.
Refreshing
Section titled “Refreshing”Click the Refresh button to reload the event list. A loading spinner is shown while the request is in progress.
Empty and Error States
Section titled “Empty and Error States”| State | Display |
|---|---|
| No events | Clock icon with “No [failover / failback / breach] events recorded” |
| Loading | Spinner with “Loading [event type]…” |
| Error | Alert icon with the error message and a Retry button |