Monitor Tab
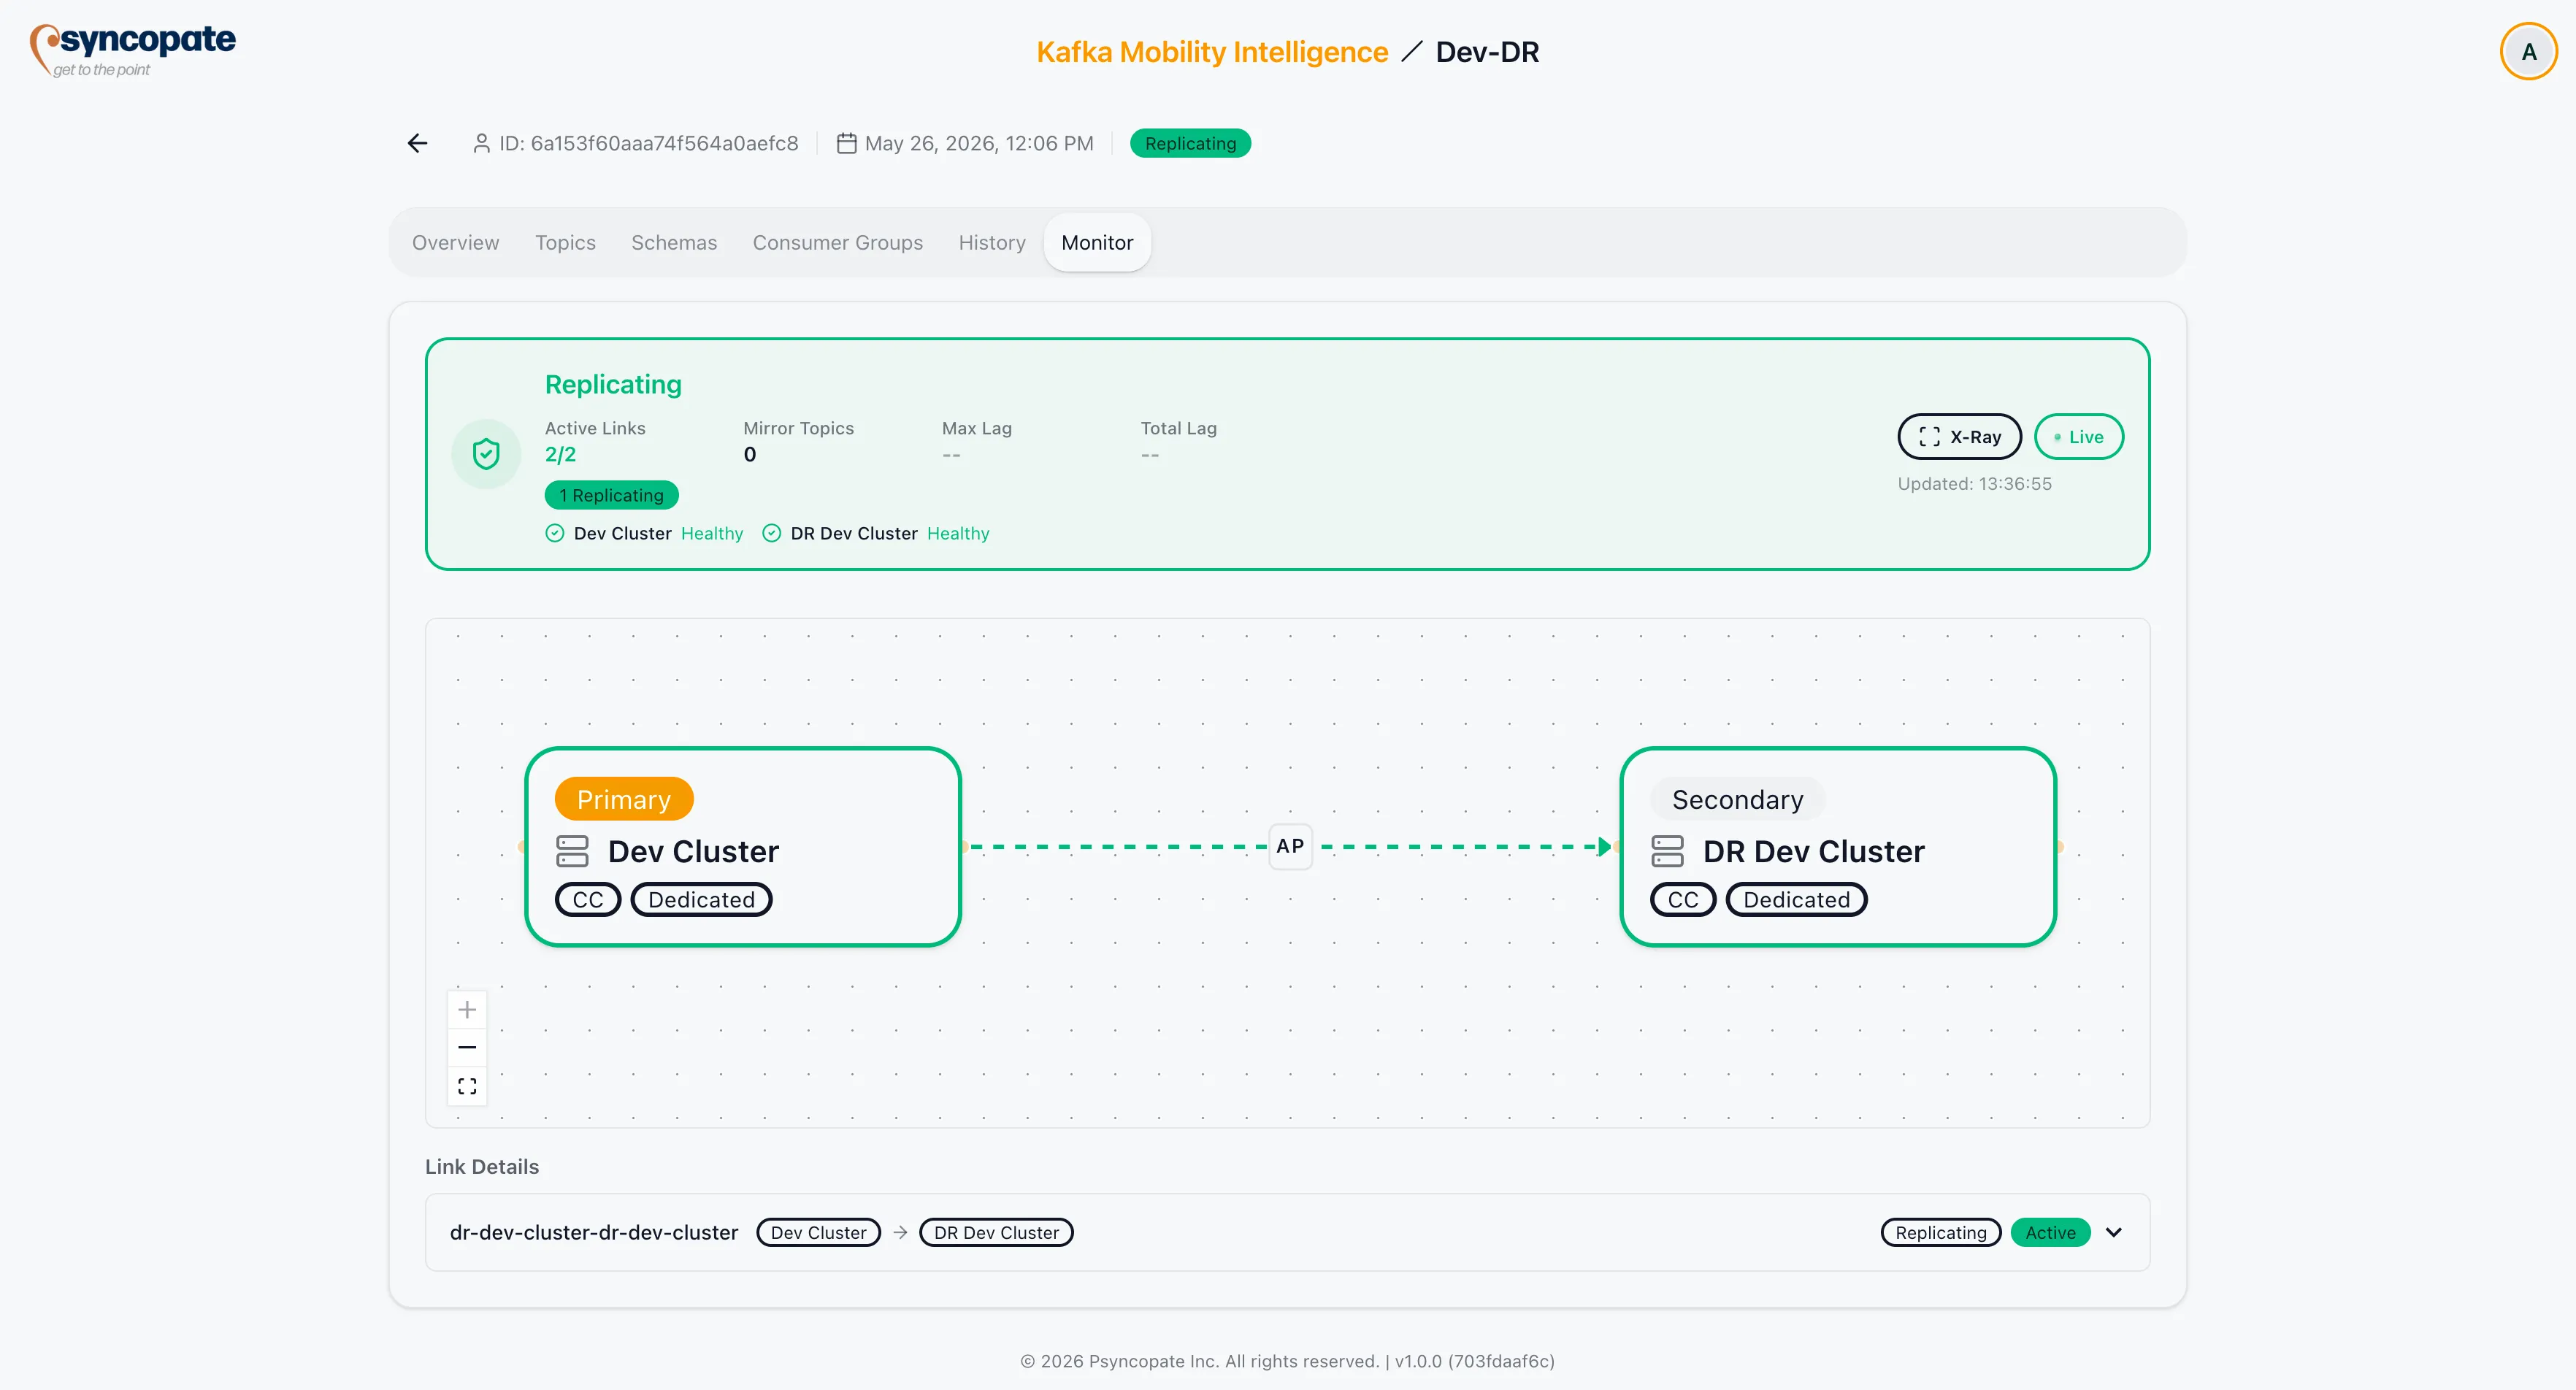
The Monitor tab provides live health data for all clusters, links, and schema exporters in a DR setup.
Status Header
Section titled “Status Header”The status header runs across the top of the tab and shows:
| Element | Description |
|---|---|
| Aggregate health icons | Health indicator per cluster and link |
| Last checked timestamp | Time of the most recent health poll |
| Auto-refresh toggle | Enables 5-second polling. Enabled by default. |
| Manual refresh button | Triggers an immediate health poll |
| X-Ray toggle | Switches the view to the X-Ray guided operations panel |
| SLA breach badge | Count of active SLA breaches. Shown when at least one breach is active. |
Monitoring Feed Staleness
Section titled “Monitoring Feed Staleness”If DataReplicatorService stops writing health snapshots for longer than the staleness threshold, the status header shows a warning banner:
Monitoring feed down, cluster health is stale since
{time}. Showing last known state.
The threshold defaults to 20 seconds, which is three to four times the service’s 5 second probe interval, and can be changed with the DR_HEALTH_SNAPSHOT_STALE_MS environment variable.
While the feed is stale, every cluster’s health shows as unknown rather than its last-known state, and the header’s freshness indicator changes from Updated: {time} to Stale: {elapsed}. This clears automatically on the next snapshot once the feed resumes.
Cluster Health Detail
Section titled “Cluster Health Detail”Click a cluster’s health chip in the status header to open the Brokers modal. It opens with a summary line carrying the broker count, and, for anything other than Confluent Cloud, the current controller as “Controller: b{id}”. When no controller ID is reported, the summary shows a “No controller” warning only if the probe positively reported that no controller is present; if it simply couldn’t determine one, the line is left out entirely rather than warning. Below that is one row per broker, with a search box and pagination once there are more than eight. Each row shows:
| Element | Description |
|---|---|
Broker {id} | The broker identifier, with a Controller badge on the current controller. The badge and the summary’s controller line are both omitted for Confluent Cloud, where the reported controller rotates between probes |
| Availability zone | An AZ badge, when the platform reports one |
| Latency | Connection latency in milliseconds, when reported |
| Status | Reachable, Unreachable, or Unknown |
If per-broker data hasn’t been reported yet, the modal reads “Per-broker reachability not reported. {N} broker(s) detected.”, or “No brokers detected yet.” when the count is zero. If no health snapshot exists yet, it shows “Cluster health not available yet.”
Topology Viewer
Section titled “Topology Viewer”An interactive canvas shows all clusters as nodes and all links as edges, colour-coded by health:
- Green: healthy
- Yellow / Orange: degraded or warning
- Red: failed or critical
Click a cluster node to expand all link accordions related to that cluster. Click a link edge to select that specific link.
SLA Breach Banner
Section titled “SLA Breach Banner”When active SLA breaches exist, a banner appears above the link accordions. It turns red when any breach is Critical and amber when all of them are Warnings. Each row reads as one line, for example:
RPO Critical: Link link-1 forward lag exceeds target. Current: 2m 30s
RTO Warning: Cluster dr-east downtime exceeds target. Current: 5m
So each row carries the severity, the dimension (RPO or RTO), the link and direction or the cluster, and the current value. It does not repeat the configured threshold; for lag against threshold, use the SLA view.
Time-based lag is formatted for readability (for example 45s, 2m 30s, 1h 30m, 1d 12h). Downtime uses a coarser format with a single unit (for example 45s, 5m, 36.0h), so a multi-day outage reads in hours rather than days. Message-based lag values show as a locale-formatted count (for example 12,345 messages).
Link Accordions
Section titled “Link Accordions”Each link has a collapsible accordion showing live data for both directions.
Direction Status
Section titled “Direction Status”Each direction (forward / reverse) shows its current link status:
| Status | Meaning |
|---|---|
| Active | Mirror topics are syncing normally |
| Paused | Mirror topic sync is paused |
| Degraded | Sync is impaired |
| Pending | Link is initialising |
| Dormant | Link exists but is not yet active |
| Promoting | Mirror topics are being promoted (planned failover in progress) |
| Promoted | Mirror topics have been promoted to regular topics |
| Failed-Over | Emergency failover completed; mirrors converted with potential data loss |
| Stopped | Link has been stopped |
| Failed | Link has encountered an error |
Lag Metrics
Section titled “Lag Metrics”- Max lag (ms): worst single-topic replication lag in milliseconds
- Max lag (messages): worst single-topic replication lag in message count
Consumer Group Offset Sync
Section titled “Consumer Group Offset Sync”- Last sync timestamp
- Enable / disable toggle (requires Manage Links permission)
Schema Exporters
Section titled “Schema Exporters”Per-exporter status for the link, consistent with the Schemas Tab.
Link Action Buttons
Section titled “Link Action Buttons”The following actions appear inside each link accordion when conditions are met and the user has Failover permission:
| Action | Description |
|---|---|
| Promote | Promotes mirror topics to regular topics (planned failover path) |
| Failover | Executes an emergency per-link failover |
| Truncate & Restore | Resets promoted mirrors on the original primary for re-import (emergency failback path) |
| Reverse & Start | Reverses the link direction and resumes replication (failback path) |
For orchestrated failover and failback across all links, use X-Ray Guided Operations.