Overview Tab
The Overview tab is the default view when opening a DR setup and shows a summary of its current state, topology, and configuration.
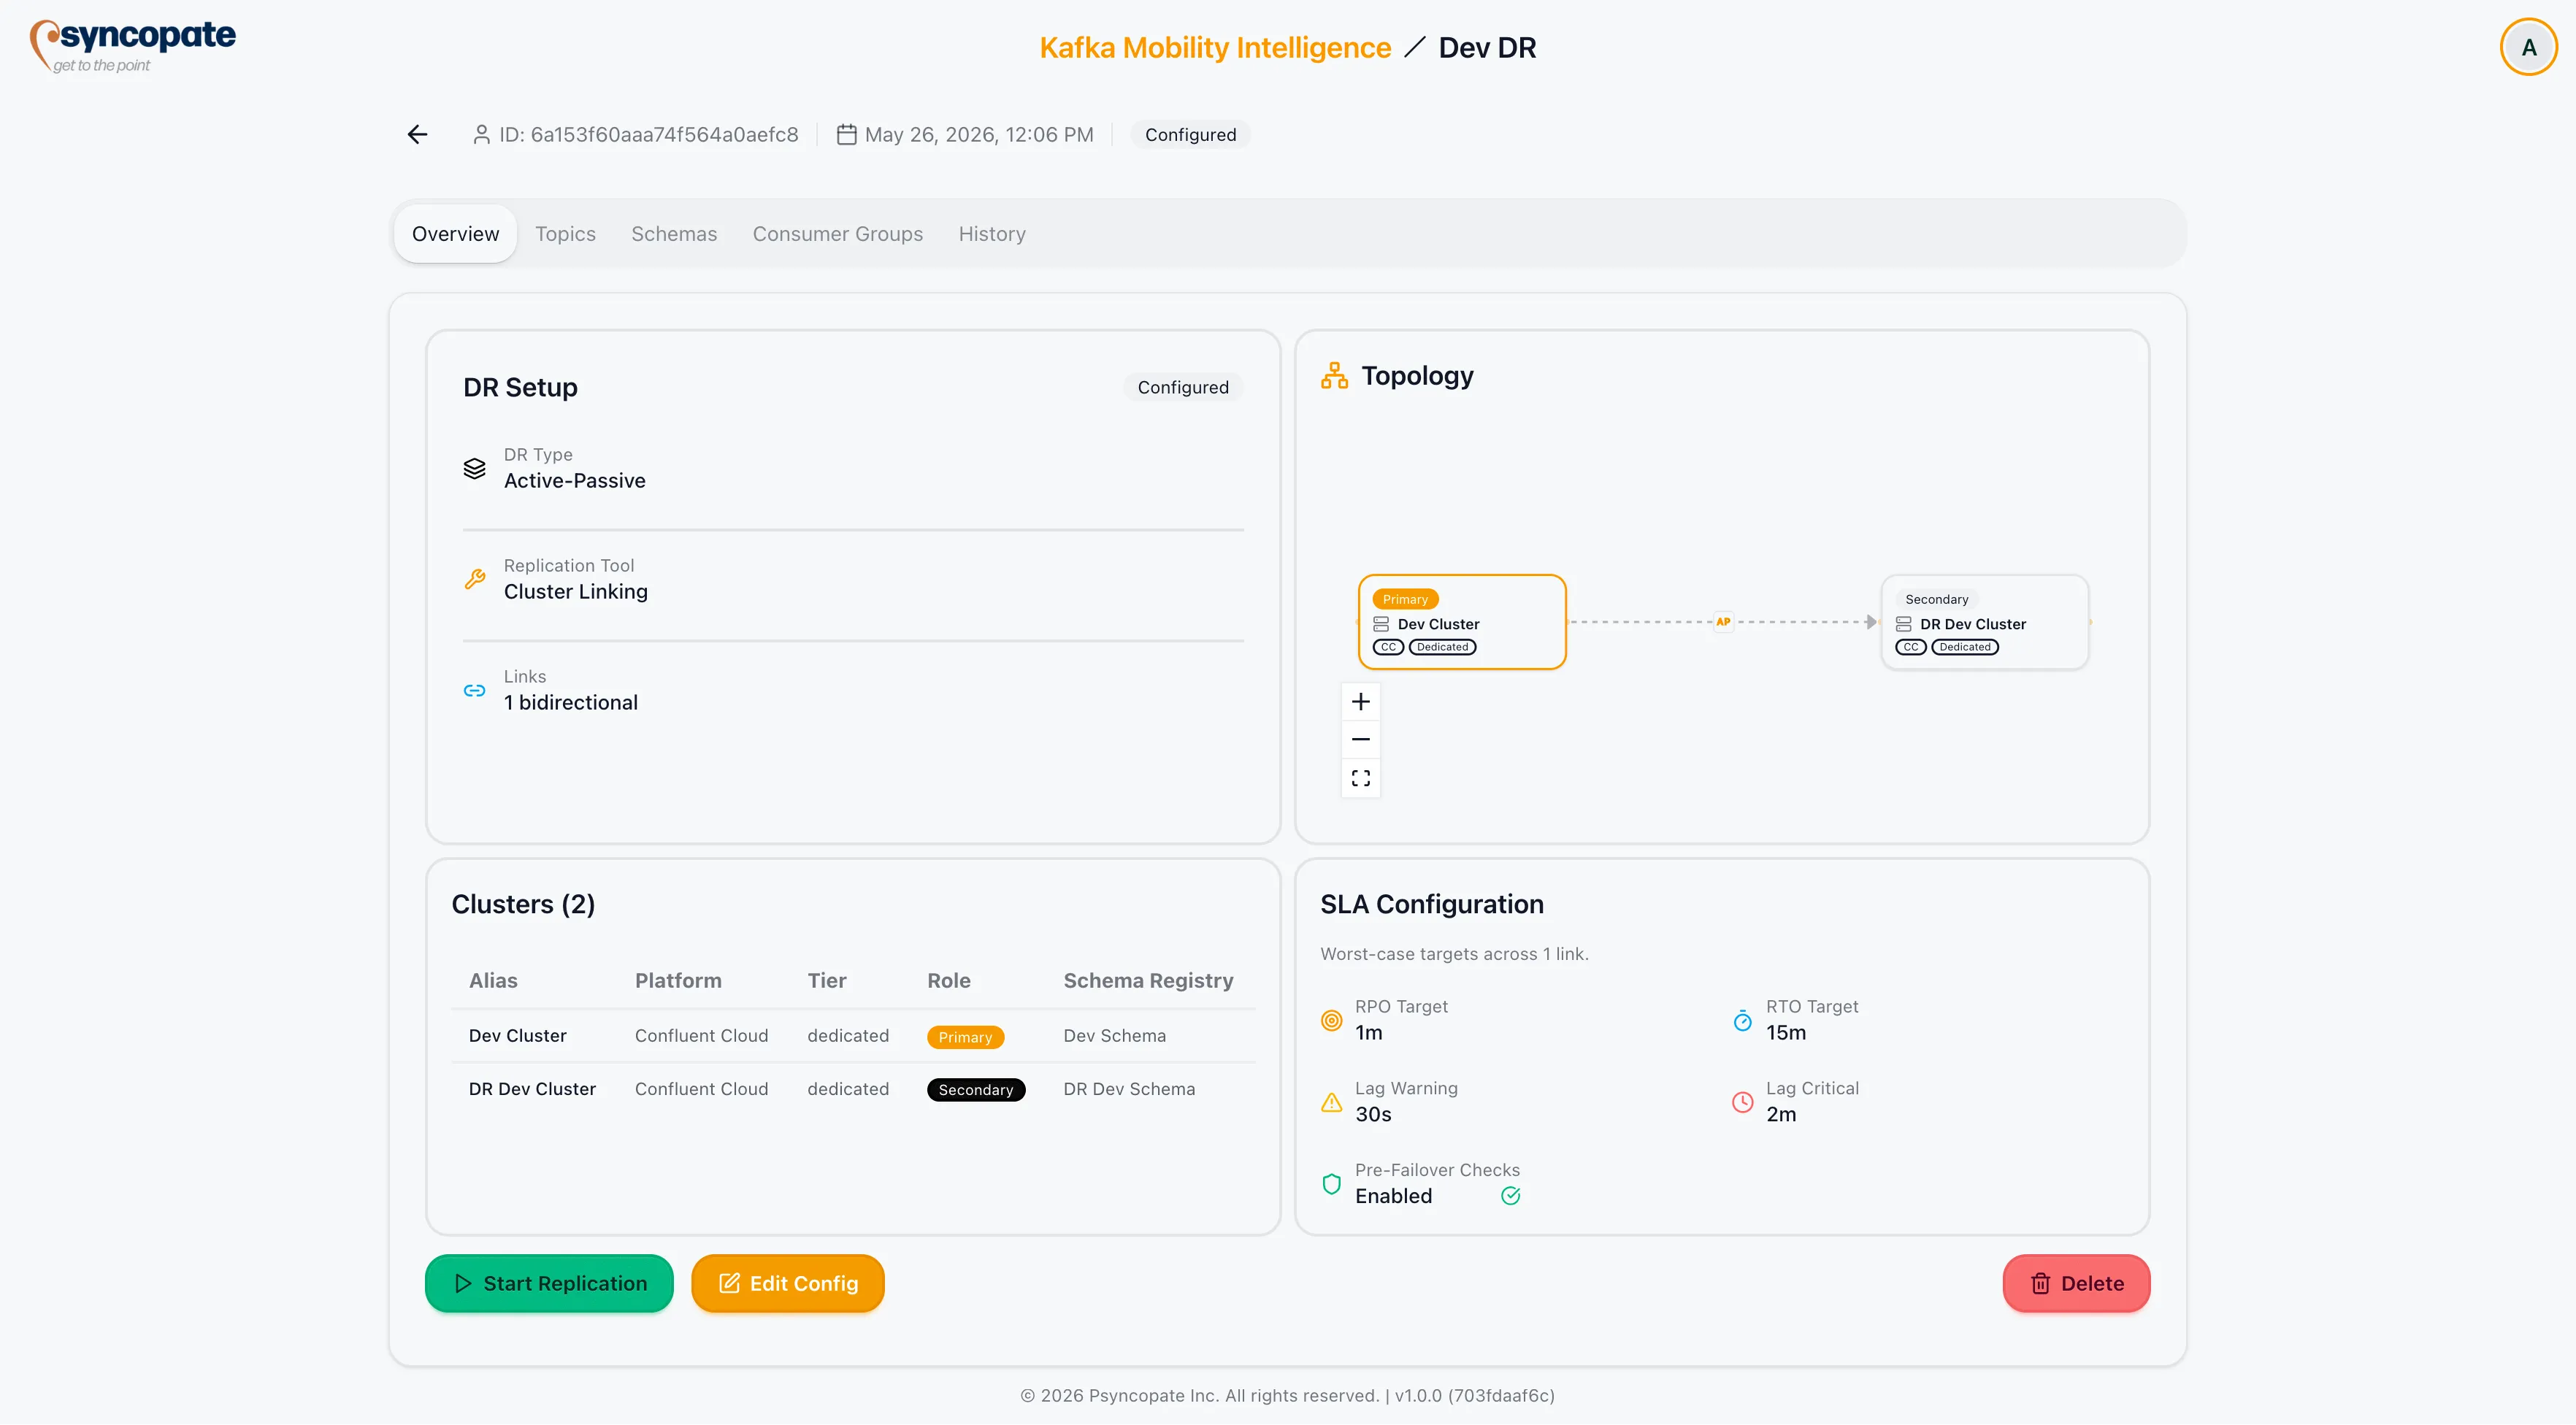
Status Cards
Section titled “Status Cards”| Card | Content |
|---|---|
| DR Status | Current DR status value with a colour-coded icon |
| Topology | Compact visual of all clusters and links |
| Clusters | Cluster roster grouped by role (Primary / Secondary / Peer) |
| SLA Status | Configured RPO/RTO thresholds and pre-failover validation flag. Only shown when at least one link is configured. |
DR Status Reference
Section titled “DR Status Reference”| Status | Colour | Meaning |
|---|---|---|
| Draft | Grey | Wizard is incomplete |
| Configured | Blue | Ready to start |
| Replicating | Green | Active replication |
| Paused | Yellow | Replication paused by operator |
| Degraded | Orange | One or more links impaired |
| Failover-In-Progress | Purple | Failover underway |
| Failed-Over | Purple | Failover complete |
| Failback-In-Progress | Purple | Failback underway |
| Failed | Red | Unrecoverable error |
| Decommissioned | Grey | Torn down, read-only |
Action Buttons
Section titled “Action Buttons”Lifecycle action buttons appear in the Overview tab. Which buttons are visible depends on the current DR status. See Start, Pause, Decommission, and Delete for the full availability table and modal behaviour.