SLA and Failover Policy
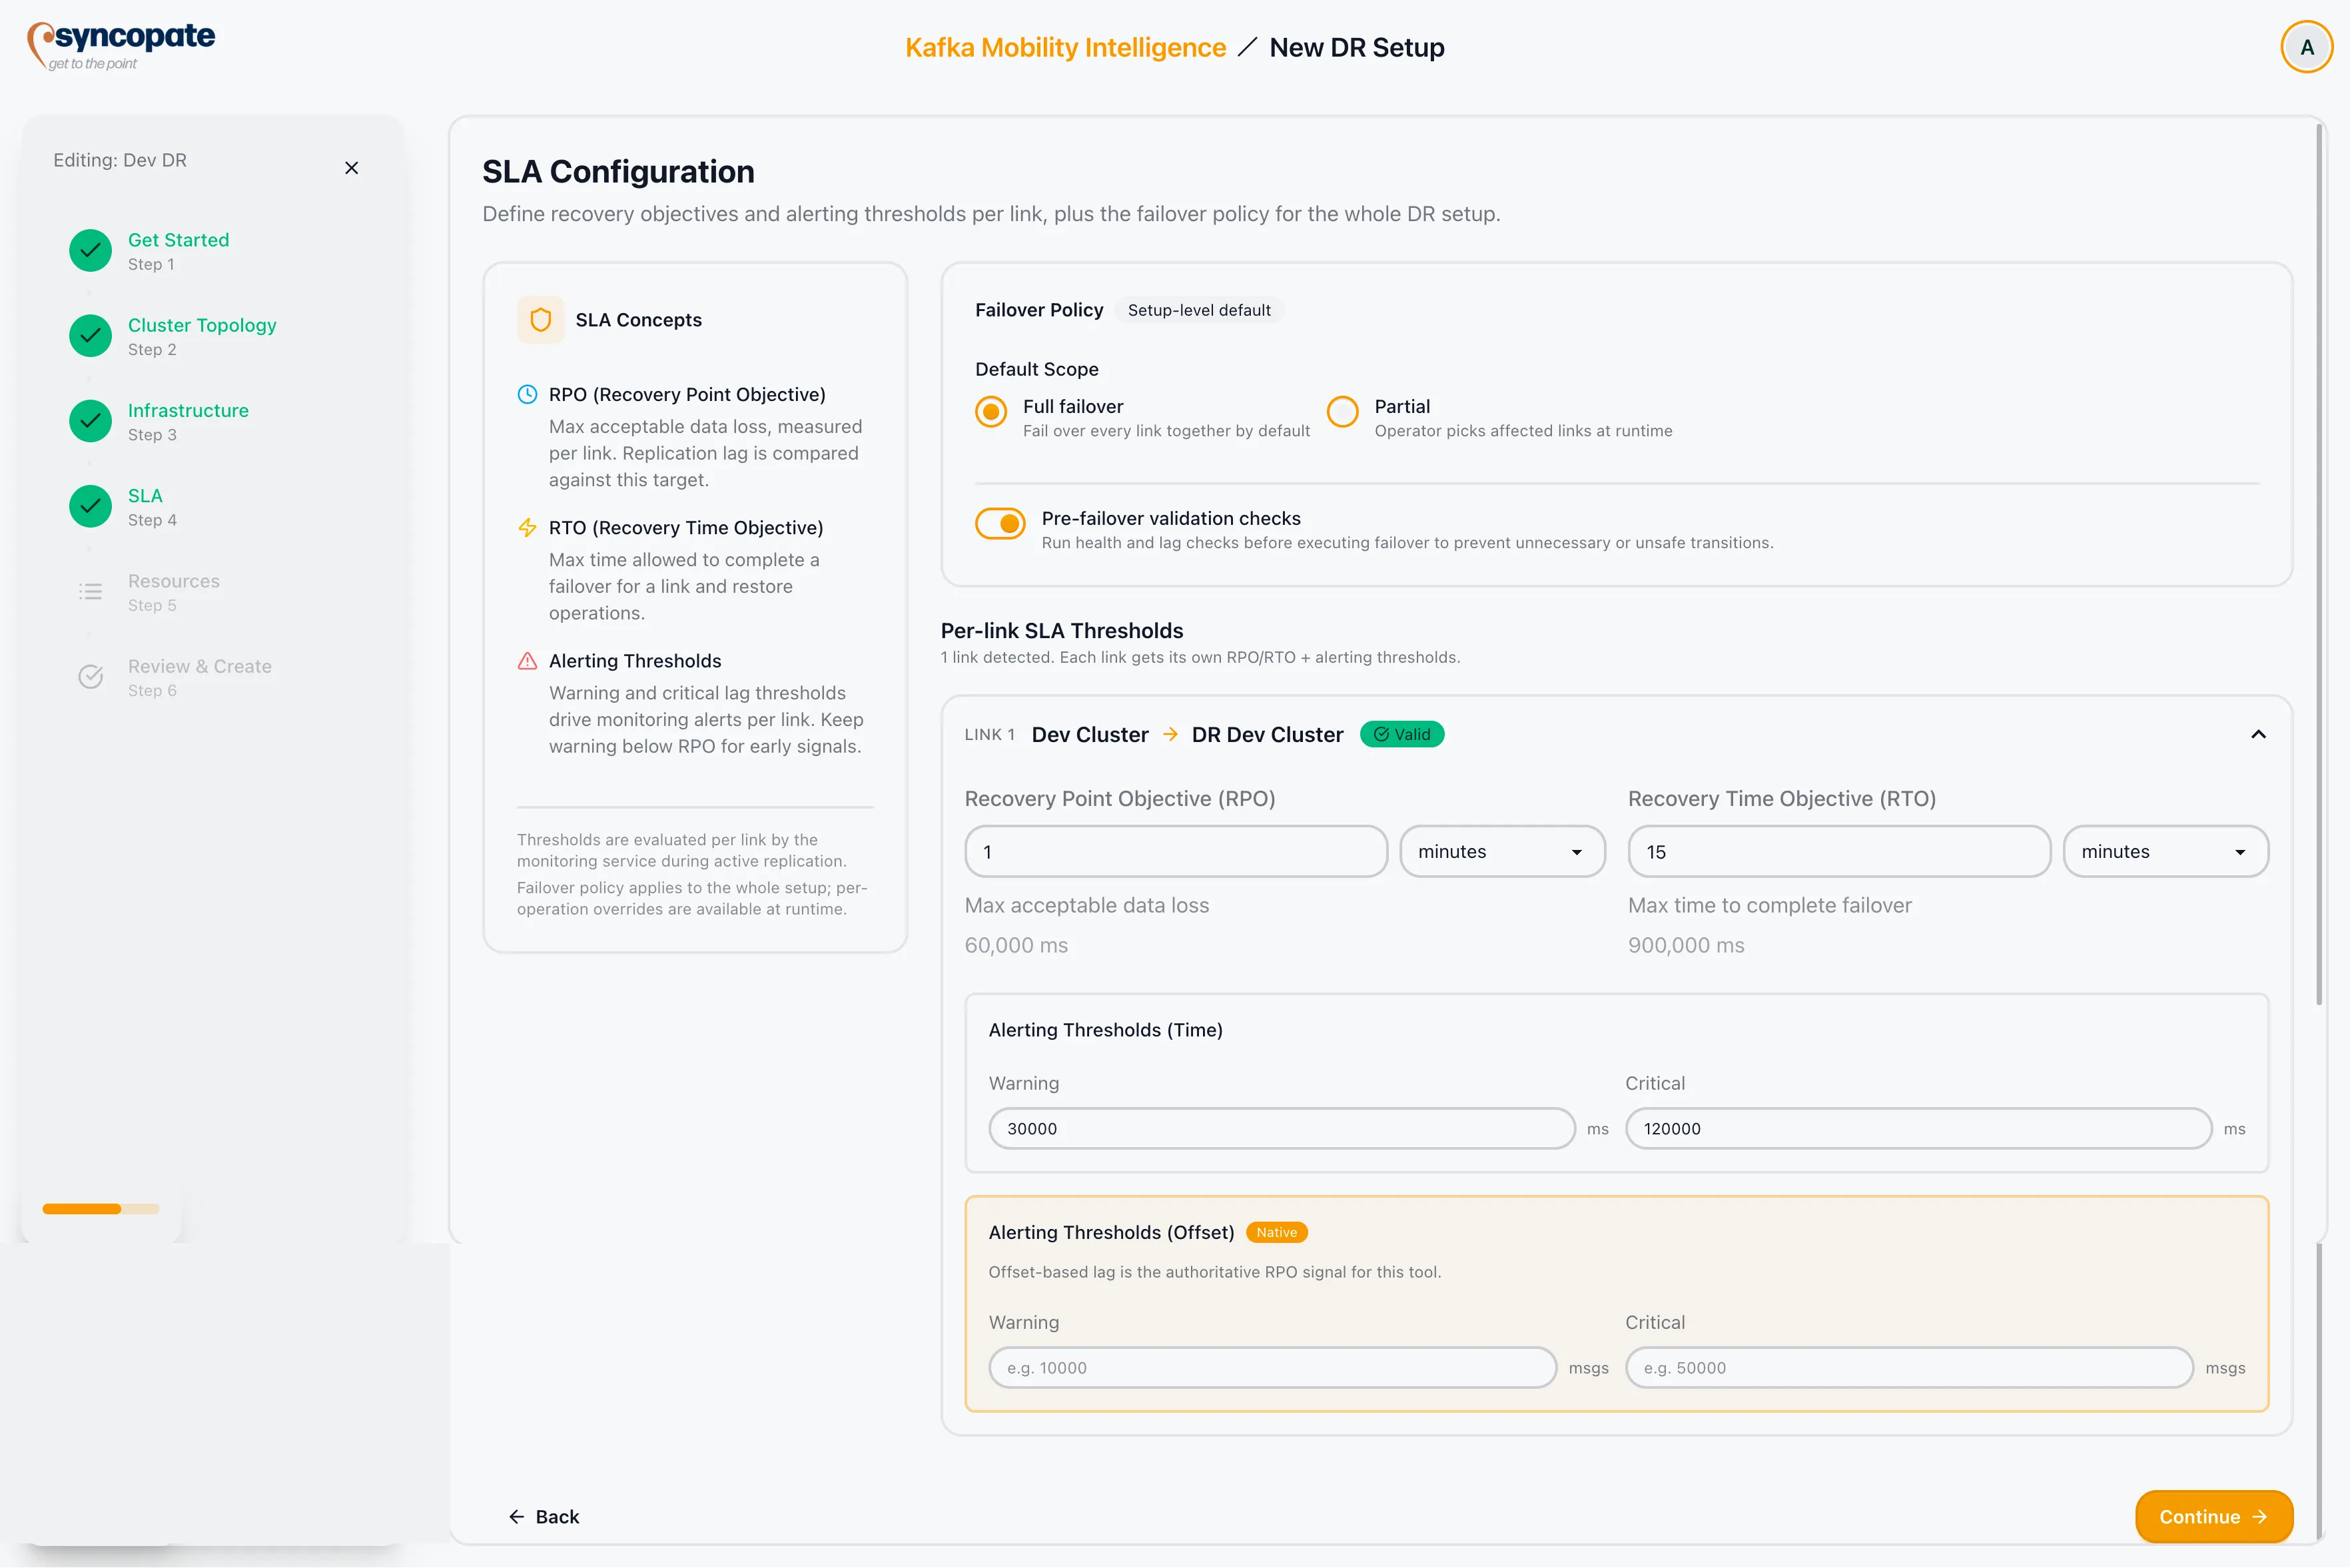
SLA and Failover Policy sets the acceptable data-loss and recovery-time targets for each link and controls how failover is triggered at the setup level.
Failover Policy
Section titled “Failover Policy”The policy card applies to the entire DR setup.
| Setting | Options | Description |
|---|---|---|
| Default Scope | Full / Partial | Full: all links fail over together by default. Partial: the operator selects which links are affected at the time of failover. |
| Pre-failover Validation | Enabled / Disabled | When enabled, health and lag checks run before a failover executes, shown as the Pre-Flight Checklist during Planned Failover/Failback. Recommended for planned failovers to prevent unsafe transitions. When disabled, the checklist does not appear at all and the operator proceeds without health-gate enforcement. |
Full failover and Pre-failover Validation are both enabled by default for new DR setups.
SLA Configuration
Section titled “SLA Configuration”One collapsible accordion is shown per link, labelled Link 1, Link 2, and so on. The accordion header shows a status badge:
| Badge | Meaning |
|---|---|
| Valid (green) | All required thresholds are configured |
| Needs attention (orange) | One or more fields are missing or invalid |
SLA Fields
Section titled “SLA Fields”Each accordion holds two target fields and two threshold sections.
| Field | Description |
|---|---|
| Recovery Point Objective (RPO) | Target for acceptable replication lag. Entered as a value plus a unit (seconds, minutes, or hours) and stored in milliseconds. Required and must be positive, but it does not drive breach detection: it’s a reference figure, shown alongside the RPO gauge and on the Overview tab’s SLA card. |
| Recovery Time Objective (RTO) | Maximum acceptable time to complete a failover and restore service. Also entered as a value plus a unit, but the unit list here offers only minutes and hours, not seconds. This one does drive the RTO gauge and the cluster-downtime breach. |
| Alerting Thresholds (Time) | A Warning and a Critical lag threshold. Required for every link: both must be set and positive, with warning below critical. |
| Alerting Thresholds (Offset) | A Warning and a Critical lag threshold in message count. Optional as a pair: leave both blank to skip offset-based detection, or set both, with warning below critical. |
Whichever dimension is native to the link’s replication tool is marked Native in the wizard, and the other section is the secondary one. For Cluster Linking, the DR default, offset lag is native and the Offset section carries the note “Offset-based lag is the authoritative RPO signal for this tool.” MirrorMaker 2 is native in time. Validation never forces the offset pair, so on a Cluster Linking link you can save a setup that only alerts on time lag; set the offset pair as well if you want alerting on the dimension the tool actually reports. A link with both dimensions configured can raise independent breaches on each; both appear in the SLA banner and count toward the breach total.
While any link is invalid, the wizard’s Continue button stays disabled and that link’s accordion shows the Needs attention badge, so an invalid setup is never submitted. Two inline messages appear under the fields: “Must exceed warning threshold” on a critical time threshold, and “Provide both; critical must exceed warning.” on a partial offset pair. Missing or non-positive RPO and RTO targets are caught by the badge and the disabled Continue rather than by an inline message, so check the fields in a link flagged Needs attention.
Copying SLA Settings Across Links
Section titled “Copying SLA Settings Across Links”When the setup has more than one link, a Copy from link 1 to all button appears in the Per-link SLA Thresholds header, above the accordions. Clicking it copies Link 1’s whole SLA form to every other link: the RPO and RTO targets and both the time and offset thresholds. A confirmation toast is shown after the copy completes.
Empty State
Section titled “Empty State”If no links have been configured in the topology step, an alert is shown: No links configured yet. Add clusters and links on the topology step before configuring SLAs. Return to the Cluster Topology step to add links before proceeding.
Breach Behaviour
Section titled “Breach Behaviour”Breach detection runs continuously while replication is active. Results appear in:
- Monitor tab: per-link breach indicators in link accordions
- SLA breach banner: shown at the top of the Monitor tab whenever any breach is active, amber for warnings and red once any breach is critical
- History -> SLA Breaches: persisted breach event log with timestamps and values